Featured - Power BI
Power BI For Capex
VNB Consulting’s Power BI For Capex Dashboards for organizations will assist any organization to derive insights and obtain clarity on their financial standing. This will aid the organizations to develop and prioritize plans into a strategic objective. Our content pack showcases the summary and details pertaining to Capital Spend , Capital Hours and Vendors information pertaining to an organization
The reports in Power BI For Capex app are created by Fiscal year and can be used by any organization to understand the trend for Dollars Spend, Hours consumed and Vendor information over the Fiscal years and optimize for the future.
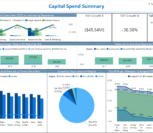
Capital Spend Summary
This report provides quick insights on Top 10 projects and project managers, YOY Forecast to Budget variance, YOY Dollars left to spend, Actuals by Department etc.
Using this report, an organization gets an idea of Growth $, Growth % and Variance between Forecasted and Actual amounts. A right click on the YOY bar chart, Top 10 charts or the pie chart will display options to drill through to reports containing details pertaining to Spend, Hours or Vendors for a Fiscal year. Additionally, a drill down from the Forecast and Budget comparison Current Year to Last Year reports on the same by regions associated with each department.
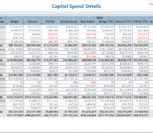
Capital Spend Details
This report provides Capital Spend detail information by Department and Region for a Fiscal year . The organization can glean information like the Budget totals, Forecast totals, Variance, Remaining Dollars and YTD amounts for the mentioned totals.
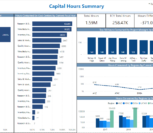
Capital Hours Summary
This report provides quick insights on Top 10 projects and project managers, YOY Forecast to Budget variance, YOY Dollars left to spend , Actuals by Department etc.
Using this report, an organization gets an idea of Growth $, Growth % and Variance between Forecasted and Actual amounts. A right click on the YOY bar chart, Top 10 charts or the pie chart will display options to drill through to reports containing details pertaining to Spend, Hours or Vendors for a Fiscal year. Additionally, a drill down from the Forecast and Budget comparison Current Year to Last Year reports on the same by regions associated with each department.
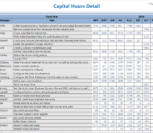
Capital Hours Details
This report provides Capital Hours detail information by Project, Project manager and task. The numbers help explain the task duration by Fiscal month and year.
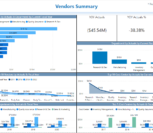
Vendor Summary
Vendor Summary enables us to determine the Vendors, Department, Cost centers that have biggest impact on actuals and side by side comparison of Actuals year over year of which were the top Departments, Cost centers. It provides quick insights on Top 10 Actual spend by Vendor and department, by Cost center, by Department. The report also displays YOY comparison of Actuals by Department and by cost center
A right click on any of the charts will display options to drill through to reports containing details pertaining to Spend, Hours or Vendors for a Fiscal year. Additionally , a drill down on the Department YOY visual will give a breakup of the Actuals by Fiscal Months.
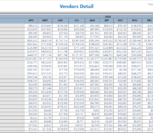
Vendor Details
This report provides Vendor detail information by each Vendor across Fiscal months for a selected Fiscal Year. The numbers help explain the actual monthly spend by Vendor.